Debugger
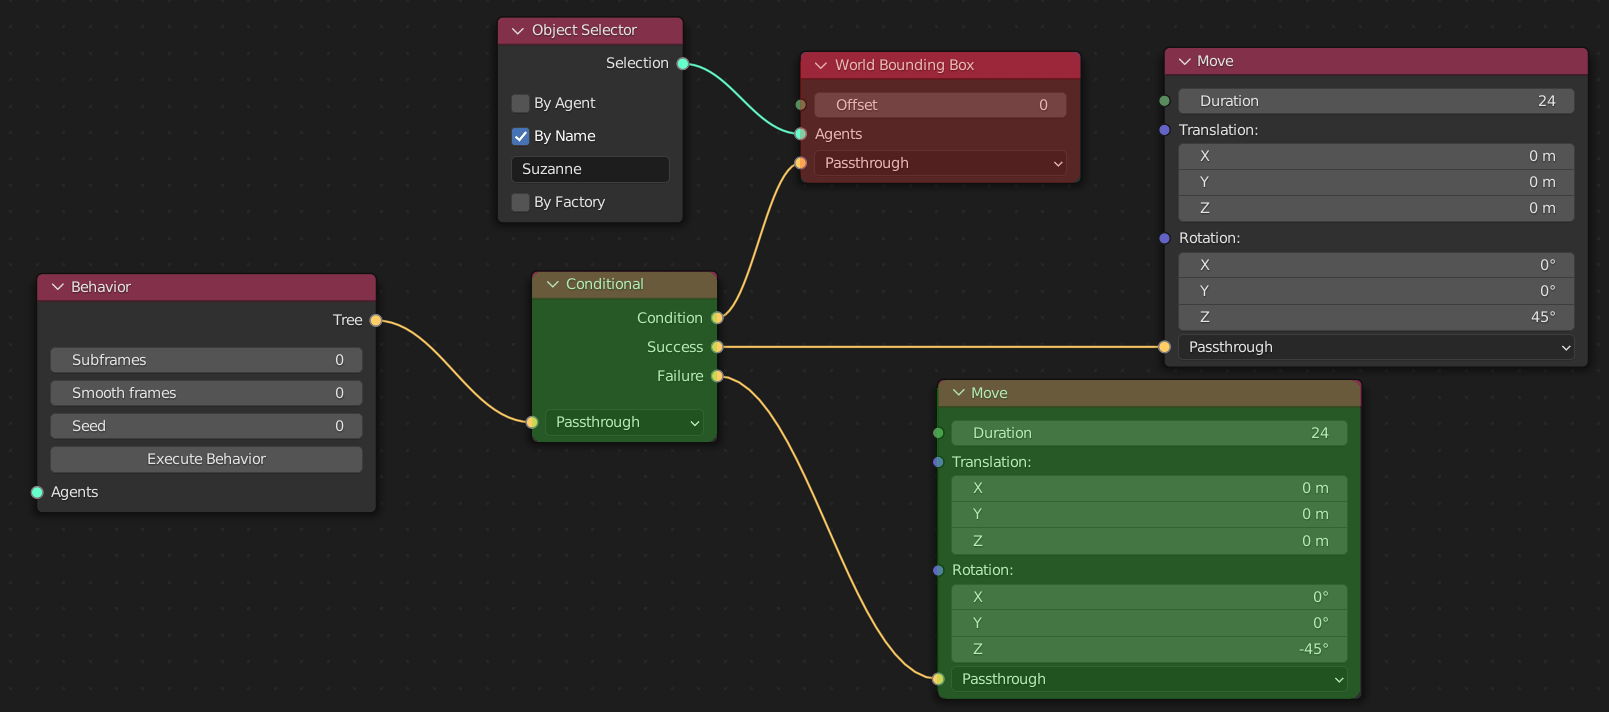
Activating the Debugger in the Properties panel will show per agent which nodes are evaluated during the simulation including there state (Success, Failure, Running, Not executed)
The debug information is gathered during execution of the behavior. In order to use the debugger you first have to enable the debugger in CrowdSim Node editor -> Sidepanel -> Debugger. After the debugger is enabled you can invoke the Execute Behavior operation on the Behavior node. During execution debug information is collected and can be showed in the node editor.
In the node editor the choices of the current frame for the active agent will be shown in colors.
Color |
Node state |
|---|---|
Green |
Success |
Red |
Failure |
Purple |
Running |
No overlay color |
Not executed |
To view the debug information of a different agent, just activate the agent where you want to view the information of. To view the state of a different frame, just jump to that frame in the timeline.
See Colorize Overlay to change the settings over the overlay.
Debug Node
When a debug node is added between nodes in the node tree that subtree state is recorded before it is executed and after the subtree has been executed.
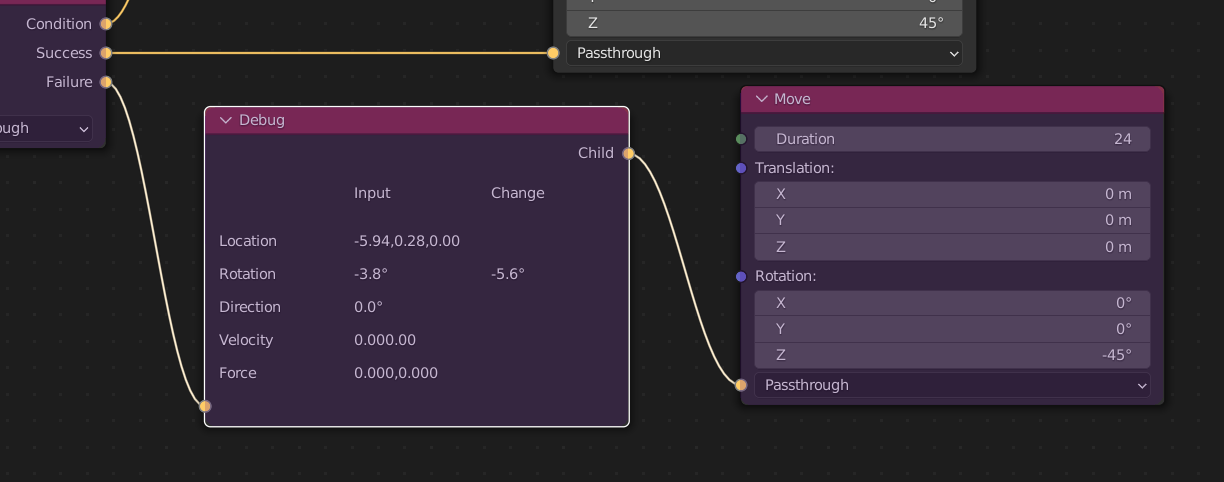
The debug node will show the state for the active agent on the current frame. The debug node shows agent data like rotation and speed, its target Properties and state properties.